DCF Series: Projecting Free Cash Flow (FCF) In The Future
A crucial part of the Discounted Cash Flow (DCF) valuation is calculating the Free Cash Flow in the future, and discounting it to its present value. I discuss the various methods for doing this in today's post.
This is part of the DCF Valuation series; if you haven't read the previous post, start here.
Projecting FCF forward
In the last post, we defined Free Cash Flow. You may have noticed that projecting FCF forward, using the earlier definition, would be a proper nightmare!
We'd have to forecast so many unknowns — like foreign currency risks, inventory and accounts receivables. That's obviously not something any outsider can predict with the degree of accuracy required to make useful conclusions.
Thankfully, we don't have to. There's a few different ways that we can do this without predicting the components of Net Cash from Operating Activities.
The easiest is by simply projecting FCF margin.
Projecting FCF margin
Recall that Free Cash Flow is a measure of how efficiently a company can generate cash. It's dependent on the operations of a business, as well as the capital expenditures they are making to sustain future growth.
A simple way to project Free Cash Flow forward is to:
- Project $$$\text{Net Revenue}$$$ forward (e.g. based on our prediction of active users $SFIX would have at each year, usually done in year-over-year terms — e.g. 10% growth in 2021 vs 2020, etc)
- Calculate average of the historical $$$\frac{\text{FCF}}{\text{Net Revenue}}$$$ ratio (the 'Average Ratio')
- Use that ratio to find FCF based on future $$$\text{Net Revenue}$$$ (by doing $$$\text{Net Revenue} * \text{Average Ratio}$$$ ) 1
Note: You can also do this with $$$\text{Net Income}$$$ so $$$\frac{\text{FCF}}{\text{Net Income}}$$$ .
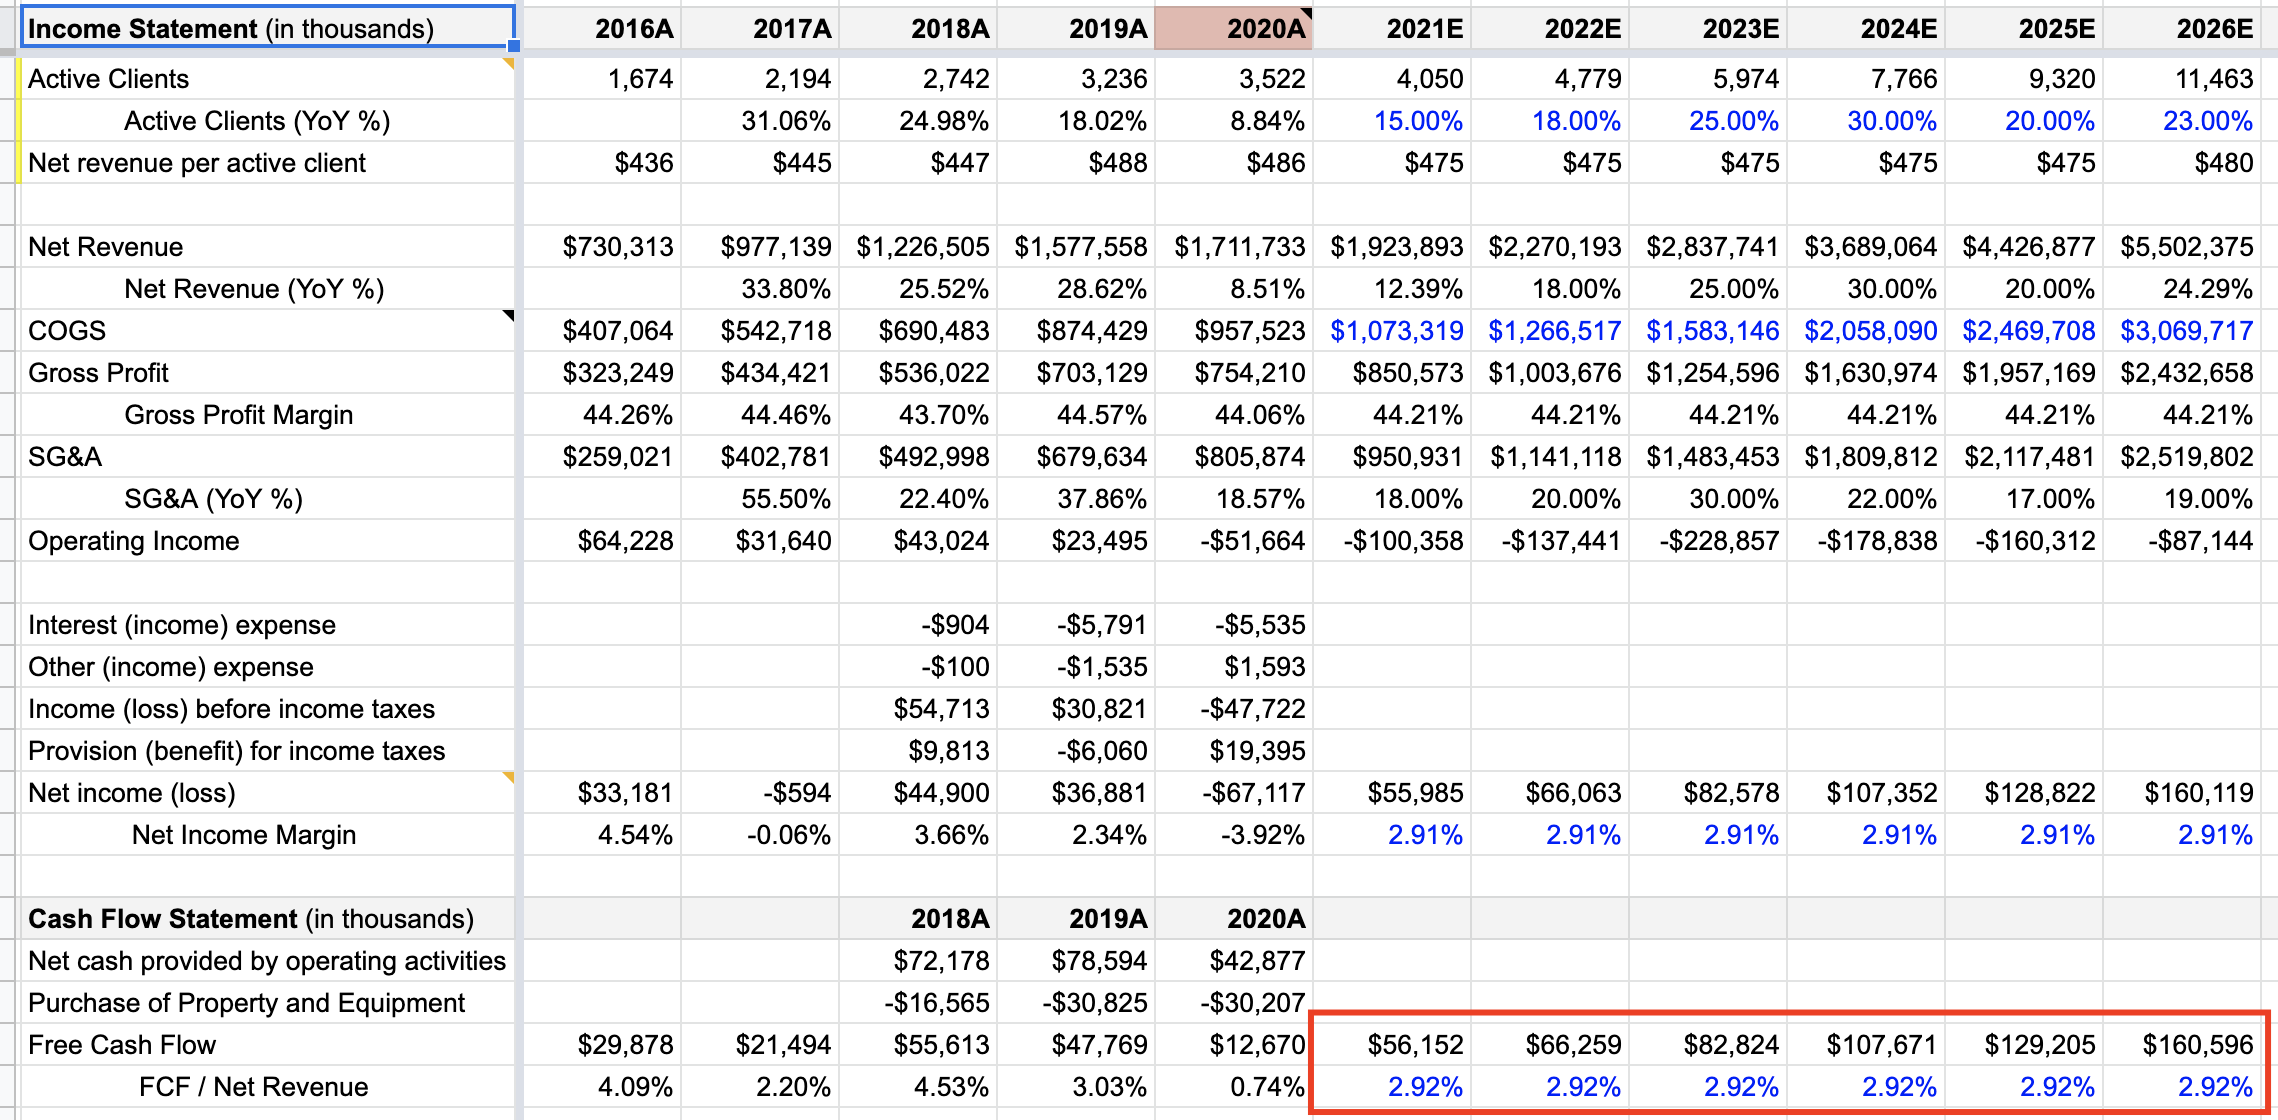
To follow our earlier example from SFIX:
| Year | FCF | Net Revenue | FCF / Net Revenue |
|---|---|---|---|
| 2016 | $29,878 | $730,313 | 4.09% |
| 2017 | $21,494 | $977,139 | 2.20% |
| 2018 | $55,613 | $1,226,505 | 4.53% |
| 2019 | $47,769 | $1,577,558 | 3.03% |
| 2020 | $12,670 | $1,711,733 | 0.74% |
The average for the past 5 years works out to 2.92%.
Now, all we need to do is multiply the Net Revenue we predicted for years 2020 - 2030 by 2.92% to get our projected FCF.
This is what the calculation looks like in the context of a completed DCF:
You can access the source 🔗 Google Sheet Valuation Model here
Next steps
Now that we have FCF for the future, we can discount the cash flows to arrive at the present value of the company.
That's the topic of my next post.
- Implicit in this approach is the assumption that the ratio between Net Revenue and Capital Expenditures will remain the same in the future. I think that's a safe assumption — unless the company was on a PP&E investing spree that's expected to be short-lived.↩